Crowdsourcing Aid :
A Case Study of the Information Chaos During India's Second Covid-19 Wave25 July 2021Executive Summary
From April to June 2021, India was ravaged by the second wave of the Covid-19 pandemic. With a steep increase in the number of infections, cities ran out of drugs, medical oxygen, hospitals and other necessary medical supplies. The second wave also ravaged rural India that had weaker public health infrastructure than urban India.
The second wave was a public health crisis, but also an information crisis. As cities ran out of medical aid, people turned to social media to request for resources outside their geographies and immediate networks. The circulation of leads for medical aid led to a concomitant increase in circulation of inaccurate leads. Fraudulent leads—of scamsters duping people of money in promise of medical supplies—were mixed in the pool of information leads on social media platforms. In addition, the status of medical leads changed rapidly—any available hospital beds or drugs were taken up within minutes of being available. Obsolete and fraudulent leads resulted in loss of critical time in medical care, money and ultimately lives. Moreover, phone numbers of individuals from marginalized identities, circulated for requesting or providing aid, were used for targeted harassment.
The crisis thus resulted in spontaneous volunteering—individuals and groups played the role of intermediaries, connecting those in need to verified leads for medical aid. WhatsApp, the most widely used social media platform in India, emerged as a natural choice to organize volunteering energies. WhatsApp could be used to source requests for help, coordinate with other volunteers and connect people to adequate aid. But how was WhatsApp used to surface actionable information and push back on inaccurate leads when the platform eludes centralized takedowns and moderation? How did individuals filter credible leads from a glut of information leads?
This report contends that the second wave of the pandemic in India showed a new facet of the Information Disorder. It was driven by a specific typology of information—of hyperlocal information leads shared during a crisis. While this category of information shares some features with the prototypical political and medical misinformation, it also merits unique attention.
We present preliminary analysis from 8 weeks of conversations in 21 Covid-19 relief WhatsApp groups that were operational during the second wave of the crisis, to shed light on the information chaos that ensued during that period. We use vector embedding based machine learning to aggregate images based on visual and semantic similarity, and language processing techniques to make sense of the multi-lingual content shared on these groups. Our preliminary analysis suggests that:
Even on WhatsApp, people relied heavily on other social media platforms such as Twitter and Instagram to find verified leads. Screenshots of posts from these platforms were commonly used method to cross-post information. Twitter has fewer than 20 million users in India. People act as ‘go-betweens’ and connect WhatsApp users to information on Twitter and Instagram, giving content on these platforms greater reach.
A comparison of phone leads shared in the WhatsApp groups with a national level database of verified leads maintained by a fact-checking group and with a crowdsourced database of ‘scam’ numbers revealed a low overlap. Less than 17% of the leads were common between the WhatsApp groups we were tracking and the databases. This indicates the scale of information that was circulated and challenge of verifying content during the second wave of the pandemic in India.
Volunteering groups asked for patient information in specific templates to make relief work more efficient. People shared doctor prescriptions, medical receipts and sensitive personal information (including the Biometric ID Aadhar) in these groups when requesting for help. Private information was circulated in groups of unknown persons who had come together for public oriented service. Public and private boundaries are more blurred in emergencies which demands greater attention to data deletion protocols by group admins.
The frequency of conversations declined in these groups over time. Some groups were repurposed to share information unrelated to Covid-19 such as chartered accountancy related webinars, reflecting the use of WhatsApp in digital marketing.
Taking note of the citizen and crowdsourced verification that sprung about during the second wave of the pandemic, we posit that the spontaneous increase in hyperlocal information demanded distributed but coordinated verification. While we have seen coordinated fact-checking operations around elections, we propose the possibility of similar coordination during sudden events such as natural disasters, cyber attacks and wars.
We note that the information chaos during the second wave in India eluded emerging response mechanisms conceived around political and medical misinformation. ‘Leads for medical aid’ as a typology of information was hyperlocal and not created or propagated in coordination. This information did not have to be viral to be harmful. People had strong incentives to seek out accurate information. Despite deliberate reasoning, the truth status of such information was not easy to discern. How platforms could have best intervened to reduce the circulation of such content is also unclear.
A case study of relief work coordinated on chat apps during the second wave of Covid-19, this analysis highlights a facet of the information disorder that could emerge in any situation where the need for reliable actionable information is high but trusted and expected information channels fail. Accounting for such situations in emerging agendas for research and action could lead to more robust toolkits for dis/misinformation response.
The Analysis
Over the 8-week period we collected 16,6944 text messages, 2,415 images (2,296 unique). We also collected over 200 videos during this time, but we did not undertake any video analysis in this study. At the time of joining, we were primarily targeting groups in English, Hindi and Marathi, since these were the languages understood by the team members. In addition, we also joined one group in Telugu. In the final sample of posts, we also found messages in Tamil, Telugu and Gujarati.
| Total Number of Groups | 21 |
|---|---|
| Number of Text Messages | 16,694 |
| Total Number of Images | 2,415 |
| Number of Unique Images | 2,296 |
| Number of Unique Senders | 1,192 |
| Duration of Analysis |
|
We relied primarily on automated techniques for broad insights about the content on the platforms. These techniques allowed for at-scale analysis of social media content but also come with inherent limitations. Machine learning based techniques, be it vector-embeddings, language translation or computer vision based text extraction, are error-prone (Please see the full report for a discussion on methodology and errors). While we attempted some correction of known errors, a lot more can be done. The analysis presented here should be treated as indication of trends that merit further investigation, and not conclusive assertions.
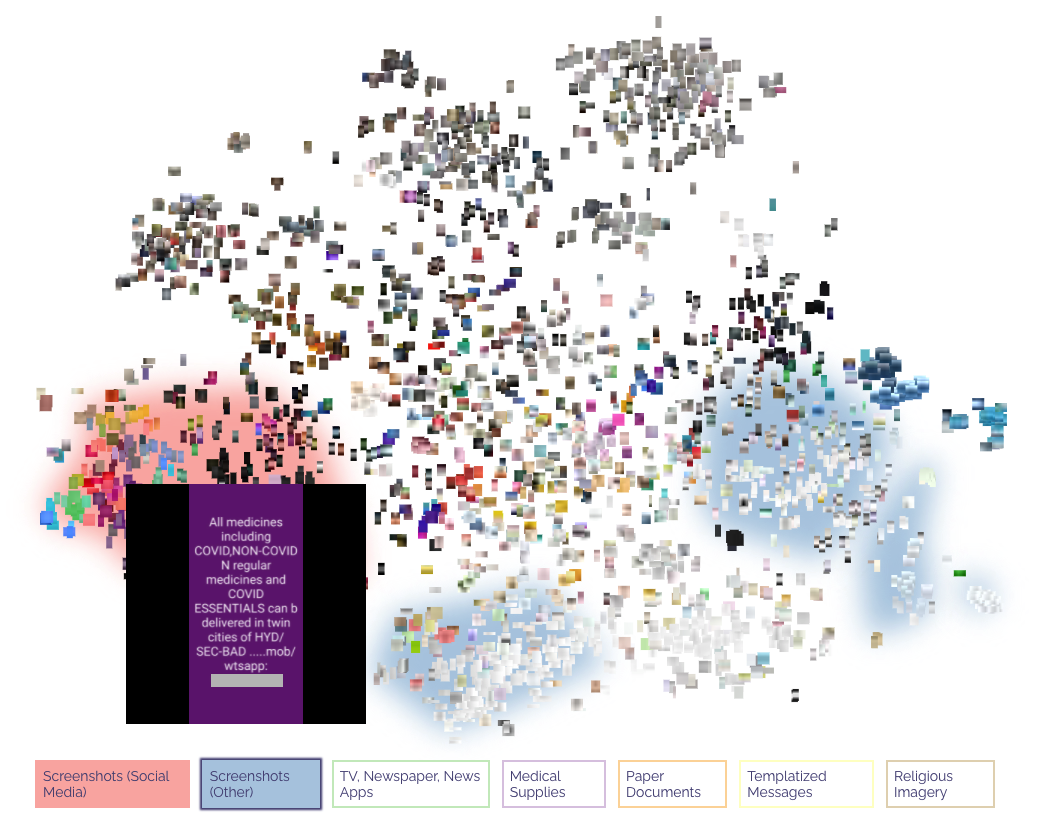
The biggest cluster in the vector embeddings based image grouping is of screenshots of posts from Twitter and Instagram. A scan of this cluster shows that majority of these screenshots are leads for medical oxygen suppliers, drugs, hospital and ICU facilities and other medical supplies, indicating heavy reliance on other social media platforms for finding medical aid. The cluster of web and mobile screenshot images is also similarly large. This cluster contains a greater diversity in the content of images—some are screenshots of WhatsApp and Facebook posts and some of apps and websites with resources of Covid-19 related information.


At least 9% of the text messages (1,551 messages) contained links to other websites. Twitter was the most popular social media in these WhatsApp groups. We found that 21% of all external links (330 messages) contained links to tweets. There were 168 messages with YouTube links; 47 with Instagram links; 190 messages contained links to other WhatsApp chat groups; and 30 contained links to Telegram groups.
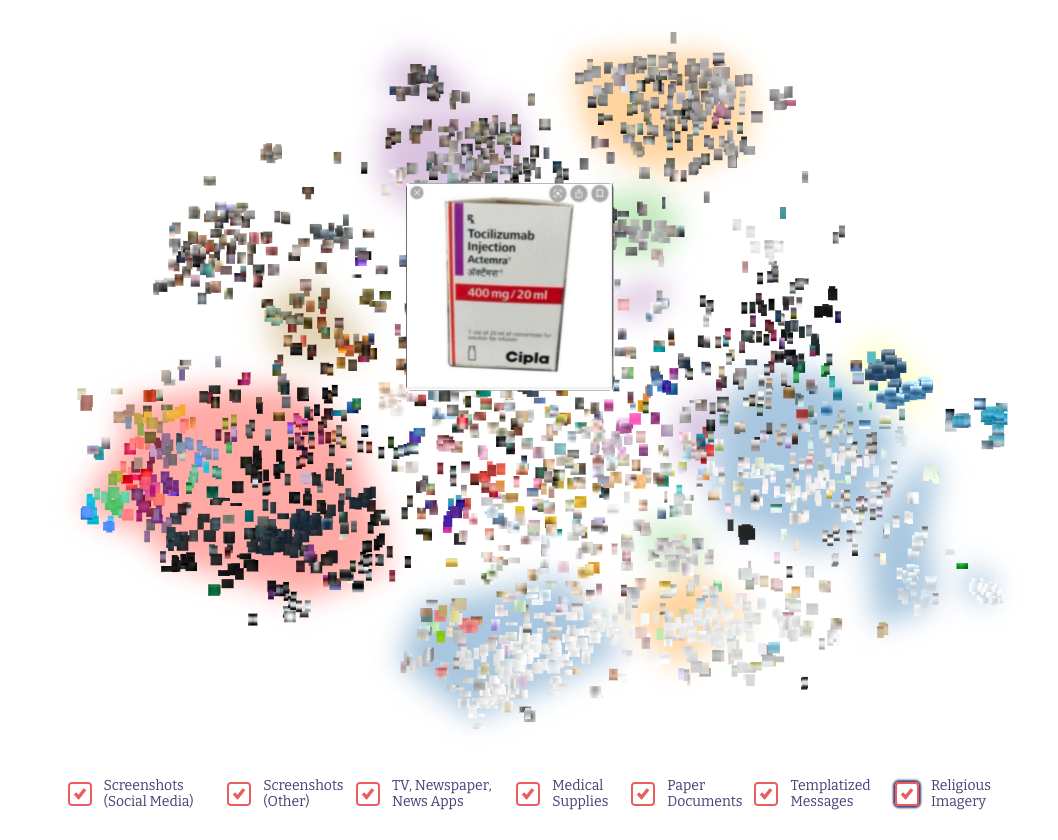
Another big cluster in the image similarity grouping is of medicines, concentrators, medical prescriptions, receipts and other paper documentation. The images seem to parallel the demand (gaps) observed. For example, there are a number of images of the drug Amphotericin, the drug used in treatment of Mucormycosis (Black Fungus). Our data collection period coincided with the rise of Mucormycosis tied to Covid-19 treatment. The multiple instances of images of Amphotericin and concentrators indicate an interest in availing or correcting information about these specific medical resources.
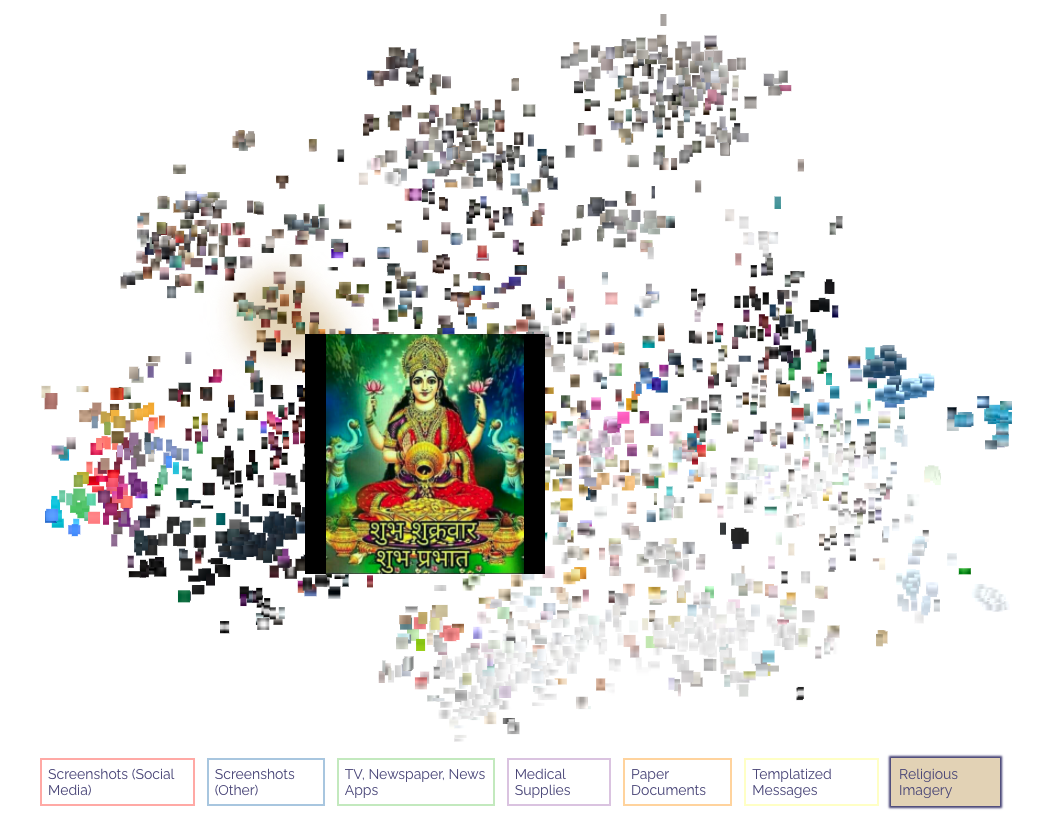
In the image grouping, we also found two unexpected clusters of images of gods and of close-up of people’s faces. We tracked the images of people’s faces to a specific spiritual WhatsApp group which had the terms ‘Covid’ and ‘healing’ in the group name. The group was sometimes used for sharing resources for Covid-19 relief, but was predominantly used for sharing images of different Indians gods.
Through basic manual annotation of the text messages on the 21 WhatsApp groups, we discovered at least 257 unique phone numbers shared as leads. We compared the phone numbers shared in the WhatsApp groups to a database of Covid-19 Helpline numbers verified by FactChecker.in, the oldest fact-checking group in India³. The fact-checking group has been verifying Covid-19 helpline numbers sourced through a tip line as well as through social media monitoring since the beginning of the second wave. As of July 4, 2021 the list had 510 ‘verified’ phone numbers.
We found that less than 15% of the leads shared in the WhatsApp text messages (37 of 257 leads) were captured by the FactChecker.in database. Accounting for the leads shared in images in these groups takes the tally of overlapping unique leads to 42. There were five leads in the images that were not contained in the text messages.
We also compared the phone leads in the text messages against a crowdsourced database of scam numbers called CoViD Scam Directory. The database is maintained by the volunteering group, CoViD Action Initiative: Cov.Social⁴. Any individual could submit an entry for a ‘scam’ number. As of July 4, 2021, the database had 812 phone records of which 647 were unique. The entire database of numbers is not open access, but the group shared the database with us on request. 16 phone numbers reported as ‘scams’ on the CoViD Scam Directory were found in the text messages. But only 2 of the numbers from the CoViD Scam Directory were shared in the WhatsApp groups as warnings. The remaining 14 were shared as genuine leads in the WhatsApp groups. Since the CoViD Scam Directory is crowdsourced, all numbers listed in the directory can't be assumed to be scam. It is however notable that even in this database the overlap of numbers is low—less than 6% of the leads shared in the 21 WhatsApp groups were captured in the CoViD Scam Directory.
We wanted to understand if the images contained similar information as text messages or if the information shared varied with the modality. We thus compared the textual content in the images with that of text messages. The word clouds of words in text messages and images hint that while the words used are common across text messages and images, they vary in their relative frequency. Words such as ‘hospital’, ‘patient’, ‘available’ are common to both text messages and images. But words such as ‘help’, ‘need’, ‘contact’, which are amongst the five most frequently used words in text messages, are not amongst even the ten most frequently used words in images.


| Term | Number of Occurences |
|---|---|
| Hospital | 1,335 |
| Need | 957 |
| Patient | 835 |
| Contact | 783 |
| Lead | 763 |
Absolute numbers of occurrence of terms across images and text can’t be directly compared since the volume of text messages is significantly higher than media messages. A comparison of the proportion or percentage of occurrence of terms (number of times a term is used divided by total number of words) in both these datasets also shows that while words such as ‘available’, ‘blood’, ‘patient’, ‘oxygen’, had nearly equal representation in images and text messages, words such as ‘need’ and ‘help’ were significantly more common in text messages. (Please see full report for more detailed analysis).
This preliminary analysis suggests that while both text messages and images (which are screenshots of information from other platforms) were used to advertise for availability of oxygen or blood donors, the request for medical aid was more often circulated as text messages native to WhatsApp. This analysis relies on text extracted from images using Cloud vision techniques and automated language translation, both of which are prone to error. The claim presented here merits more in-depth research, with more manual scanning of individual messages.
Since we had tracked only sixteen groups for the entire 8-week duration, we limited the temporal analysis to the sixteen groups. Furthermore, we discovered that text messages were missing for a few days of the first week. We thus discarded content from the first week and carried out temporal analysis over a 7-week period starting from 6th May 2021 and ending on 25th June 2021.


To carry out the temporal analysis, we analyzed the prominent words uses in each of the 7 weeks. The aggregate analysis of word frequencies in text messages showed that words such as ‘hospitals’, ‘patient’, ‘oxygen’, ‘blood’ were prominent in text messages. Even in the list of 30 most frequently used, the frequency of usage of these terms is significantly higher than the frequency of other terms on the list.
While recognizing that these words were important in the text messages during the 7 weeks, we wanted to capture the unique themes in a conversation in any week. For that, we used a technique called Term Frequency - Inverse Document Frequency (TF-IDF) which gives prominence to words in a week that are more salient compared to terms in other 6 weeks. Words such as ‘hospital’ and ‘oxygen’ may still feature in a specific week, which would imply that their usage in that week was notably higher than the other weeks.
Analyzing the most frequent words (adjusted for popularity across weeks) we see that the word ‘oxygen’ stops appearing in the frequent words list after 20th May 2021. The prominence of the words ‘hospital’ and ‘plasma’ also decline over the 7 weeks. Instead, we see words associated with hyperlinks like ‘https’, ‘com’ become more prominent. In the last week in particular, it seems that WhatsApp chat links were the prominent theme. Unexpectedly, we also see words such as ‘CA’, ‘income’ and ‘tax‘ feature in the last two weeks.
We tracked these terms to a specific group that had started as a Covid-19 relief group but towards the end turned into a group for primarily sharing material related to chartered accountancy. A few links on chartered accountancy related webinars were shared on this group even in the last week of May. Towards late June, information about webinars on lung recovery and other health related topics was still shared on these groups, but its proportion relative to information about chartered accountancy declined.
Key Takeaways
Public and Private Boundaries Are More Blurred in Emergencies. In a state of crisis people willingly shared sensitive personal data with a group of strangers. Enabling messages to disappear after a certain duration can minimize access of such data to ill-intentioned actors on these groups. Admins might also consider deleting the groups altogether, if the group is no longer serving the purpose it was created for. Destruction of data is the final step in data life cycle management and one that WhatApp group admins could heed more carefully.
The Social Media Mix-and-Match. It appears that WhatsApp was the primary channel to collect requests for aid, but when it came to advertising availability of resources, people also sought information on Twitter and Instagram. This analysis reveals an important role for the ‘go-betweens’ who connect WhatsApp users to information on Twitter and Instagram, giving content on these platforms greater reach than that reflected by the engagement metrics on the platforms.
Credibility Indicators for WhatsApp. The technical design of messaging apps notwithstanding, some credibility markers to assess whether a lead shared could be trusted were needed. We saw several messages being ‘signed’ with a time stamp and/or information about the originator of the information. These credibility markers can be spoofed. But social practices for information quality management in closed messaging apps deserve more attention.
The Need for Distributed but Coordinated Verification. The phone numbers shared in the Covid-19 relief groups, had low (less than 17%) overlap with an external database of verified leads, as well as with a crowdsourced database of scam phone numbers— the majority of numbers shared in this small sample of 21 groups could not be or had not been verified. The second wave of the pandemic in India resulted in an unprecedented situation that challenged the process of verification. It resulted in spontaneous generation of hyperlocal information across India, simultaneously. This demanded localized verification efforts, but also demonstrated the need for coordination of these efforts.
A New Facet of The Information Disorder. The relief work during the second wave resulted in a new typology of (mis)information that eludes emerging conceptions of misinformation response that rely on enhancing human reasoning for misinformation resilience or suppressing content on platforms tied to inauthentic behaviour. This phenomenon could repeat in any situation where the need for reliable actionable information is high but trusted and expected information channels fail such as natural disasters, cyberattacks or wars. Accounting for these less frequent, but extreme situations can strengthen our conceptions and agendas for misinformation response.
Resources
² L.J.P. van der Maaten and G.E. Hinton. ‘Visualizing High-Dimensional Data Using t-SNE’. Journal of Machine Learning Research 9(Nov):2579-2605, 2008.
³ FactChecker.in (2021, June 22). ‘FactChecker Called Up All COVID-19 Helplines’. FactChecker.in. Accessed on 6 July 2021
⁵ Silge J., Robinson D., Section 1.5. Text Mining with R: A Tidy Approach. O Reilly. 2017.(link)
For extensive references please see full report. The code used in analysis can be found at here and here
For questions and feedback about this work, please email us at tarunima@tattle.co.in or denny@tattle.co.in